File:Fishing-pressure-by-region (OWID 0427).png
Jump to navigation
Jump to search
Size of this preview: 800 × 565 pixels. Other resolutions: 320 × 226 pixels | 640 × 452 pixels.
Original file (850 × 600 pixels, file size: 88 KB, MIME type: image/png)
Captions
Captions
Add a one-line explanation of what this file represents
Summary[edit]
.png&action=edit§ion=1)
| Fishing pressure by region | |
|---|---|
| Title |
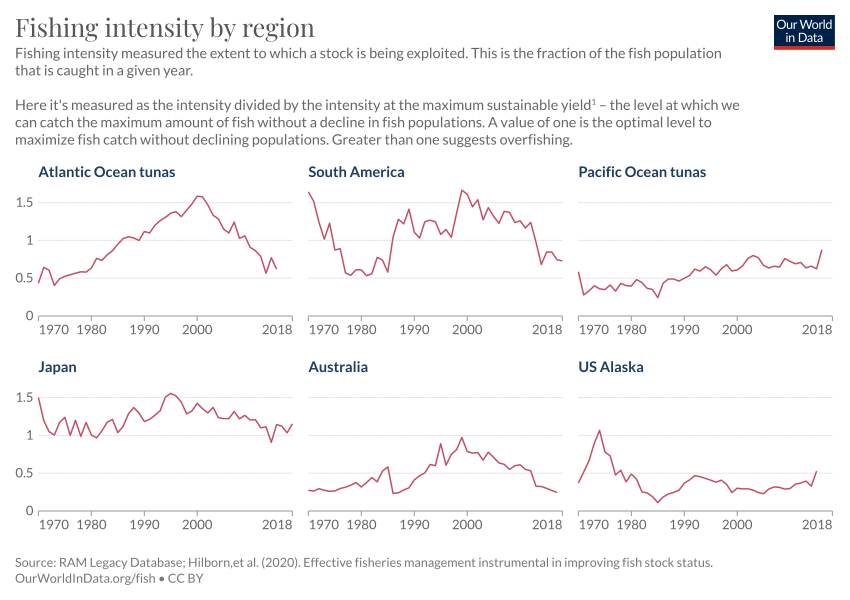
Fishing pressure by region |
| Description |
Fishing intensity by region. Fishing intensity measured the extent to which a stock is being exploited. This is the fraction of the fish population that is caught in a given year. Here it's measured as the intensity divided by the intensity at the maximum sustainable yield" - the level at which we can catch the maximum amount of fish without a decline in fish populations. A value of one is the optimal level to maximize fish catch without declining populations. Greater than one suggests overfishing. |
| Credit line | Our World in Data |
| References | RAM Legacy Database; Hilborn,et al. (2020). Effective fisheries management instrumental in improving fish stock status. |
| Source | https://OurWorldinData.org/fish |
| Permission (Reusing this file) |
Our World in Data openly licence all text and visualisations on their website. |
Licensing[edit]
.png&action=edit§ion=2)
This file is licensed under the Creative Commons Attribution 4.0 International license.
- You are free:
- to share – to copy, distribute and transmit the work
- to remix – to adapt the work
- Under the following conditions:
- attribution – You must give appropriate credit, provide a link to the license, and indicate if changes were made. You may do so in any reasonable manner, but not in any way that suggests the licensor endorses you or your use.
File history
Click on a date/time to view the file as it appeared at that time.
| Date/Time | Thumbnail | Dimensions | User | Comment | |
|---|---|---|---|---|---|
| current | 17:31, 14 July 2023 | | 850 × 600 (88 KB) | Jason.nlw (talk | contribs) | pattypan 22.03 |
You cannot overwrite this file.
File usage on Commons
The following page uses this file:
.png)
.png&oldid=878498808)