Category:Our World in Data - Education and Knowledge
Jump to navigation
Jump to search
Subcategories
This category has only the following subcategory.
Media in category "Our World in Data - Education and Knowledge"
The following 158 files are in this category, out of 158 total.
-
 Actual teaching time as share of scheduled teaching time, OWID.svg 850 × 600; 13 KB
-
 Actual teaching time vs time teachers are present, OWID.svg 850 × 600; 10 KB
-

-
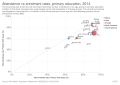 Attendance vs enrolment rates, primary education, OWID.svg 850 × 600; 16 KB
-

-
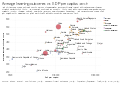 Average learning outcomes vs GDP per capita, OWID.svg 850 × 600; 24 KB
-

-

-

-

-

-
 Average years of schooling vs. Corruption Perception Index, OWID.svg 850 × 600; 25 KB
-
 Average years of schooling vs. Expected years of schooling, OWID.svg 850 × 600; 38 KB
-
 Average years of schooling vs. GDP per capita, OWID.svg 850 × 600; 36 KB
-
-

-

-

-

-
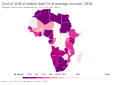 Cost of 1GB of mobile data (% of average income), OWID.svg 850 × 600; 139 KB
-
 Cross-country-literacy-rates.svg 850 × 600; 27 KB
-
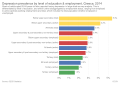 Depression prevalence by level of education and employment, OWID.svg 850 × 600; 10 KB
-
-
 Employment rate with tertiary vs vocational education, OWID.svg 850 × 600; 14 KB
-
 Employment rates of 25-34 year-olds by education level, OWID.svg 850 × 600; 16 KB
-
 Expected years of schooling vs. GDP per capita, OWID.svg 850 × 600; 36 KB
-

-
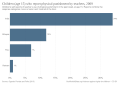
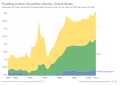 Funding sources for public schools, OWID.svg 850 × 600; 13 KB
-

-

-

-
 Gender ratios for mean years of schooling, OWID.svg 850 × 600; 16 KB
-

-

-

-

-
 Government expenditure on education, OWID.svg 850 × 600; 9 KB
-
 Government expenditure on primary education by country, OWID.svg 850 × 600; 13 KB
-

-

-

-
 Gross enrollment ratio in tertiary education, OWID.svg 850 × 600; 10 KB
-
 Gross vs. net enrollment rate in pre-primary education, OWID.svg 850 × 600; 30 KB
-
 Gross vs. net enrollment rate in primary education, OWID.svg 850 × 600; 38 KB
-
 Human Capital Index in males vs. females, OWID.svg 850 × 600; 28 KB
-
 Improved-weather-forecasting 7463.png 7,463 × 6,130; 787 KB
-
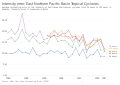 Intensity error, OWID.svg 850 × 600; 12 KB
-
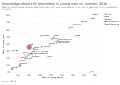 Knowledge about HIV prevention in young men vs. women, OWID.svg 850 × 600; 20 KB
-
 Learning outcomes, minimum vs advanced achievement, OWID.svg 850 × 600; 25 KB
-
 Literacy rate vs. GDP per capita, OWID.svg 850 × 600; 25 KB
-

-
-
 Literacy-rate-of-young-men-and-women-line.png 3,400 × 2,400; 375 KB
-
 Literacy-rate.svg 850 × 600; 26 KB
-
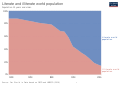
 Literate and illiterate world population over time.png 1,200 × 800; 93 KB
-
 Literate and illiterate world population, 1, OWID.svg 850 × 600; 6 KB
-
 Literate and illiterate world population, OWID.svg 850 × 600; 6 KB
-
 Literate and illiterate world population.png 1,038 × 679; 31 KB
-

-
 MDG2.A- Net enrolment rate in primary education, OWID.svg 850 × 600; 6 KB
-
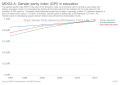 MDG3.A- Gender parity index (GPI) in education, OWID.svg 850 × 600; 8 KB
-

-

-
 National average learning outcomes, 1985 vs 2015, OWID.svg 850 × 600; 20 KB
-
 National average learning outcomes, OWID.svg 850 × 600; 14 KB
-

-
 Number of enrolled children in pre-primary education, OWID.svg 850 × 600; 18 KB
-

-
 Number of out-of-school children, OWID.svg 850 × 600; 10 KB
-
 Number of out-of-school children.jpg 823 × 595; 56 KB
-

-
 Number of published titles, OWID.svg 850 × 600; 12 KB
-
 Number of teachers across education levels, OWID.svg 850 × 600; 11 KB
-

-

-
 Out-of-school girls of primary school age by world region, OWID.svg 850 × 600; 15 KB
-

-
 Percentage of primary schools with access to potable water, OWID.svg 850 × 600; 139 KB
-
 Percentage of primary schools with toilets, OWID.svg 850 × 600; 138 KB
-
 Percentage of teachers absent from class, OWID.svg 850 × 600; 5 KB
-
 Percentage of teachers absent from school, OWID.svg 850 × 600; 5 KB
-
 PISA average math score, Male vs Female, OWID.svg 850 × 600; 19 KB
-
 PISA score of the best and worst student by country, OWID.svg 850 × 600; 19 KB
-
 PISA scores of 15-year-olds by reading proficiency level, OWID.svg 850 × 600; 10 KB
-
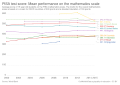 PISA test score- Mean performance on the mathematics scale, OWID.svg 850 × 600; 13 KB
-
 PISA- Mean performance on the mathematics scale, by sex, OWID.svg 850 × 600; 19 KB
-
 PISA- Mean performance on the reading scale, by sex, OWID.svg 850 × 600; 19 KB
-
 Political regime vs. Mean years of schooling, OWID.svg 850 × 600; 26 KB
-

-

-
 Poverty vs. educational attainment, OWID.svg 850 × 600; 18 KB
-
 Primary completion rate (% of relevant age group), OWID.svg 850 × 600; 12 KB
-
 Primary education priority vs. Overall education priority, OWID.svg 850 × 600; 22 KB
-

-
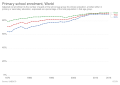
 Primary school enrollment, OWID.svg 850 × 600; 21 KB
-
 Primary school enrolment, 1970 - 2016.png 3,400 × 2,400; 365 KB
-
 Primary school enrolment, OWID.svg 850 × 600; 12 KB
-
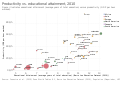 Productivity vs. educational attainment, OWID.svg 850 × 600; 18 KB
-
 Productivity vs. share of tertiary schooling, OWID.svg 850 × 600; 44 KB
-

-
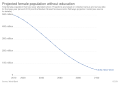 Projected female population without education, OWID.svg 850 × 600; 5 KB
-
 Projected world population by level of education over time.png 1,200 × 800; 164 KB
-
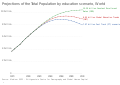
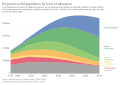 Projected world population by level of education, OWID.svg 850 × 600; 15 KB
-

-

-

-

-
-

-
-
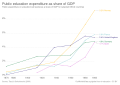 Public education expenditure as share of GDP, OWID.svg 850 × 600; 8 KB
-
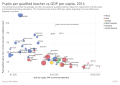 Pupils per qualified teacher vs GDP per capita, OWID.svg 850 × 600; 19 KB
-
 Relative share of Google searches for causes of death, OWID.svg 850 × 600; 18 KB
-

-

-
 SACMEQ- Mean performance on the 6th grade mathematics scale, OWID.svg 850 × 600; 139 KB
-
 Scheduled teaching time that teachers are in the classroom, OWID.svg 850 × 600; 10 KB
-

-

-
 Share of education in government expenditure, OWID.svg 850 × 600; 10 KB
-

-
-
-

-
 Share of primary-school-age children who are out of school, OWID.svg 850 × 600; 22 KB
-
 Share of public who knew extent of women in education, OWID.svg 850 × 600; 11 KB
-

-

-

-

-
 Share of schools with access to basic drinking water, OWID.svg 850 × 600; 6 KB
-

-

-
 Share of schools with access to electricity, OWID.svg 850 × 600; 5 KB
-

-
 Share of students achieving advanced learning outcomes, OWID.svg 850 × 600; 11 KB
-
 Share of students achieving intermediate learning outcomes, OWID.svg 850 × 600; 14 KB
-
 Share of students achieving minimum learning outcomes, OWID.svg 850 × 600; 11 KB
-

-

-

-

-

-
-

-

-

-
 Share of working children who work only, OWID.svg 850 × 600; 10 KB
-
-
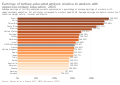
 Starting salaries for teachers in public primary education, OWID.svg 850 × 600; 13 KB
-
 Total government expenditure on education (% GDP), OWID.svg 850 × 600; 40 KB
-
 Total government expenditure on education, OWID.svg 850 × 600; 14 KB
-
 Total net enrollment rate in primary education by sex, OWID.svg 850 × 600; 33 KB
-
 Unemployment rate, basic vs advanced education, OWID.svg 850 × 600; 28 KB
-
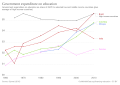
 US education expenditure as share of GDP, OWID.svg 850 × 600; 8 KB
-
 Women's educational attainment vs. fertility, OWID.svg 850 × 600; 32 KB
-

-
 Working children out of school vs Hours worked by children, OWID.svg 850 × 600; 17 KB


,_1,_OWID.svg)


_vs_national_literacy_rate,_OWID.svg)


_who_report_physical_punishment_by_teachers,_OWID.svg)
_who_report_physical_punishment_by_teachers,_OWID.svg)


,_OWID.svg)


,_OWID.svg)


_vs_self-reports_(UNESCO),_OWID.svg)
_vs_self-reports_(UNESCO),_OWID.svg)


_in_education,_OWID.svg)


_by_continent,_OWID.svg)


_vs._Mean_years_of_schooling,_OWID.svg)


,_OWID.svg)


_by_highest_educational_attainment,_OWID.svg)


_not_in_education,_employment_or_training,_OWID.svg)


,_OWID.svg)

,_OWID.svg)


