Category:Linguistic maps of South Africa to 2001
Jump to navigation
Jump to search
Media in category "Linguistic maps of South Africa to 2001"
The following 106 files are in this category, out of 106 total.
-
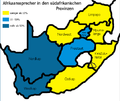
 Afrikaans speakers density ZA.svg 995 × 768; 900 KB
-
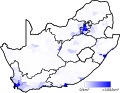
 Afrikaans speakers proportion ZA.svg 995 × 768; 899 KB
-
 Afrikaansdistrib.png 1,145 × 828; 36 KB
-
 Cape Town 2001 dominant language map.svg 814 × 966; 1.48 MB
-
 Eastern Cape 2001 dominant language map.svg 1,233 × 811; 1.5 MB
-
 Ekurhuleni 2001 dominant language map.svg 778 × 1,011; 1.17 MB
-
 English speakers density ZA.svg 995 × 768; 900 KB
-
 English speakers proportion ZA.svg 995 × 768; 899 KB
-
 Ethekwini 2001 dominant language map.svg 805 × 977; 3.18 MB
-
 Free State 2001 dominant language map.svg 1,095 × 913; 1.44 MB
-
 Gauteng 2001 dominant language map.svg 996 × 1,004; 1.03 MB
-
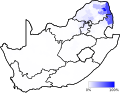
 IsiNdebele speakers density ZA.svg 995 × 768; 900 KB
-
 IsiNdebele speakers proportion ZA.svg 995 × 768; 899 KB
-
 IsiXhosa speakers density ZA.svg 995 × 768; 900 KB
-
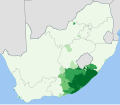
 IsiXhosa speakers proportion ZA.svg 995 × 768; 899 KB
-
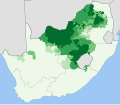
 IsiZulu speakers density ZA.svg 995 × 768; 900 KB
-
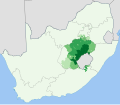
 IsiZulu speakers proportion ZA.svg 995 × 768; 899 KB
-
 Johannesburg 2001 dominant language map.svg 786 × 1,000; 1.65 MB
-
 Johannesburg language.gif 943 × 638; 159 KB
-
 KwaZulu-Natal 2001 dominant language map.svg 938 × 1,066; 1.06 MB
-
 Languages RSA English.png 1,844 × 1,638; 156 KB
-
 Languages RSA IsiNdebele.png 1,844 × 1,638; 154 KB
-
 Languages RSA SePedi.png 1,844 × 1,638; 155 KB
-
 Languages RSA SeSotho.png 1,844 × 1,638; 158 KB
-
 Languages RSA Seswana.png 1,844 × 1,638; 158 KB
-
 Languages RSA SiSwati.png 1,844 × 1,638; 154 KB
-
 Languages RSA TshiVenda.png 1,844 × 1,638; 153 KB
-
 Languages RSA XiTsonga.png 1,844 × 1,638; 156 KB
-
 LanguagesRSA Afrikaans.png 1,844 × 1,638; 163 KB
-
 LanguagesRSA IsiXhosa.png 1,844 × 1,638; 160 KB
-
 LanguagesRSA IsiZulu.png 1,844 × 1,638; 156 KB
-
 Limpopo 2001 dominant language map.svg 1,228 × 814; 812 KB
-
 Mapa de hablantes del Afrikáans.svg 995 × 768; 384 KB
-
 Mpumalanga 2001 dominant language map.svg 1,015 × 986; 1.14 MB
-
 Nelson Mandela Bay 2001 dominant language map.svg 991 × 793; 614 KB
-
 Nguni group speakers density ZA.svg 995 × 768; 900 KB
-
 Nguni group speakers proportion ZA.svg 995 × 768; 899 KB
-
 Non-official language speakers density ZA.svg 995 × 768; 900 KB
-
 Non-official languages speakers proportion ZA.svg 995 × 768; 899 KB
-
 North West 2001 dominant language map.svg 1,208 × 828; 1.2 MB
-
 Northern Cape 2001 dominant language map.svg 990 × 1,010; 864 KB
-
 RSA languages plurality.png 1,844 × 1,840; 168 KB
-
 Sesotho sa Leboa speakers density ZA.svg 995 × 768; 900 KB
-
 Sesotho sa Leboa speakers proportion ZA.svg 995 × 768; 899 KB
-
 Sesotho speakers density ZA.svg 995 × 768; 900 KB
-
 Sesotho speakers proportion ZA.svg 995 × 768; 899 KB
-
 Sesothodistrib-ZA.gif 1,146 × 828; 14 KB
-
 Setswana speakers density ZA.svg 995 × 768; 900 KB
-
 Setswana speakers proportion ZA.svg 995 × 768; 899 KB
-
 SiSwati speakers density ZA.svg 995 × 768; 900 KB
-
 SiSwati speakers proportion ZA.svg 995 × 768; 899 KB
-
 Sotho-Tswana group speakers density ZA.svg 995 × 768; 900 KB
-
 Sotho-Tswana group speakers proportion ZA.svg 995 × 768; 899 KB
-
 South Africa 2001 Afrikaans speakers density map.svg 1,072 × 933; 1.23 MB
-
 South Africa 2001 Afrikaans speakers proportion map.svg 1,072 × 933; 479 KB
-
 South Africa 2001 dominant language map.svg 1,072 × 933; 1,024 KB
-
 South Africa 2001 English speakers density map.svg 1,072 × 933; 913 KB
-
 South Africa 2001 English speakers proportion map.svg 1,072 × 933; 237 KB
-
 South Africa 2001 linguistic distribution of white people map.svg 1,072 × 933; 1.55 MB
-
 South Africa 2001 Ndebele speakers density map.svg 1,072 × 933; 510 KB
-
 South Africa 2001 Ndebele speakers proportion map.svg 1,072 × 933; 157 KB
-
 South Africa 2001 Nguni speakers density map.svg 1,072 × 933; 1.47 MB
-
 South Africa 2001 Nguni speakers proportion map.svg 1,072 × 933; 458 KB
-
 South Africa 2001 non-official language speakers density map.svg 1,072 × 933; 478 KB
-
 South Africa 2001 non-official language speakers proportion map.svg 1,072 × 933; 139 KB
-
 South Africa 2001 Northern Sotho speakers density map.svg 1,072 × 933; 715 KB
-
 South Africa 2001 Northern Sotho speakers proportion map.svg 1,072 × 933; 228 KB
-
 South Africa 2001 Sotho speakers density map.svg 1,072 × 933; 974 KB
-
 South Africa 2001 Sotho speakers proportion map.svg 1,072 × 933; 263 KB
-
 South Africa 2001 Sotho-Tswana speakers density map.svg 1,072 × 933; 1.22 MB
-
 South Africa 2001 Sotho-Tswana speakers proportion map.svg 1,072 × 933; 446 KB
-
 South Africa 2001 Swati speakers density map.svg 1,072 × 933; 569 KB
-
 South Africa 2001 Swati speakers proportion map.svg 1,072 × 933; 167 KB
-
 South Africa 2001 Tsonga speakers density map.svg 1,072 × 933; 594 KB
-
 South Africa 2001 Tsonga speakers proportion map.svg 1,072 × 933; 191 KB
-
 South Africa 2001 Tswana speakers density map.svg 1,072 × 933; 744 KB
-
 South Africa 2001 Tswana speakers proportion map.svg 1,072 × 933; 263 KB
-
 South Africa 2001 Venda speakers density map.svg 1,072 × 933; 395 KB
-
 South Africa 2001 Venda speakers proportion map.svg 1,072 × 933; 163 KB
-
 South Africa 2001 West Germanic speakers density map.svg 1,072 × 933; 1.36 MB
-
 South Africa 2001 West Germanic speakers proportion map.svg 1,072 × 933; 595 KB
-
 South Africa 2001 Xhosa speakers density map.svg 1,072 × 933; 1.12 MB
-
 South Africa 2001 Xhosa speakers proportion map.svg 1,072 × 933; 319 KB
-
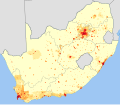
 South Africa 2001 Zulu speakers density map.svg 1,072 × 933; 973 KB
-
 South Africa 2001 Zulu speakers proportion map.svg 1,072 × 933; 279 KB
-
 South Africa municipalities by language 2001.png 1,146 × 828; 50 KB
-
 Speakers of afrikaans german.png 541 × 455; 66 KB
-
 Tshivenda speakers density ZA.svg 995 × 768; 900 KB
-
 Tshivenda speakers proportion ZA.svg 995 × 768; 899 KB
-
 Tshwane 2001 dominant language map.svg 821 × 958; 1.42 MB
-
 West Germanic group speakers density ZA.svg 995 × 768; 900 KB
-
 West Germanic group speakers proportion ZA.svg 995 × 768; 899 KB
-
 Western Cape 2001 dominant language map.svg 1,126 × 888; 406 KB
-
 Xitsonga speakers density ZA.svg 995 × 768; 900 KB
-
 Xitsonga speakers proportion ZA.svg 995 × 768; 899 KB
-
 ZA Cape Town language.gif 900 × 640; 60 KB
-
 ZA Eastern Cape language.gif 943 × 667; 92 KB
-
 ZA Free State language.gif 943 × 667; 115 KB
-
 ZA Gauteng language.gif 943 × 667; 77 KB
-
 ZA KwaZulu-Natal language.gif 943 × 667; 91 KB
-
 ZA Limpopo language.gif 943 × 667; 133 KB
-
 ZA map language.gif 943 × 667; 86 KB
-
 ZA Mpumalanga language.gif 943 × 667; 112 KB
-
 ZA North-West Province language.gif 943 × 667; 160 KB
-
 ZA Northern Cape language.gif 943 × 667; 115 KB
-
 ZA Western Cape language.gif 943 × 667; 77 KB


