User talk:Cmglee/archive2021
| 2O11 | 2O12 | 2O13 | 2O14 | 2O15 | 2O16 | 2O17 | 2O18 | 2O19 | 2O2O |
| 2O21 | 2O22 | 2O23 | 2O24 | ||||||
Similar image to Lent_calendar.svg
[edit]Hi! Is there a similar calendar to https://commons.wikimedia.org/wiki/File:Lent_calendar.svg but for the advent sundays? eg with https://en.wikipedia.org/wiki/Stir-up_Sunday and https://en.wikipedia.org/wiki/Gaudete_Sunday etc, That would be really useful! I've tried to find names of the other sundays but haven't been successful. But if you want to make that, I will post them here, if I find them. CatCat (talk) 14:33, 18 February 2021 (UTC)
- Hi @CatCat, I'm unfamiliar with this subject and a brief search didn't find anything besides w:Advent Sunday and w:Gaudete Sunday. Try asking at w:Wikipedia:Reference_desk/Humanities. Good luck, cmɢʟee ⋅τaʟκ 19:01, 18 February 2021 (UTC)
Simplification
[edit]Hi Cmglee, I gave your user logo a look.
- You made it 512 × 384 px, viewboxing to 56 × 42. This causes an odd factor of 9.142857... - it is always better to avoid such odd numbers. I tried to redraw it with 56 × 42, which is a bit small and caused decimal fractions - but an exact copy with 512 × 384 px would have caused numerous odd coordinates. I would have chosed e.g. 400 × 300, which gave better measures, without decimal fractions.
- You used cropping (and linecapping). Each one of the incomplete circles will need 20 to 22 bytes, while each one of your
useinstructions needed 67 bytes - it is much cheaper to draw the six circles one after the other, instead of cloning them. Some of the circles could have been drawn at their position, avoiding to clone them from 0,0. - The same can be done with the four "spots", so I drew each one directly.
- In my drawing concept, the single path for the circles is drawn with linefeeds, for a better readability; of course it can as well be drawn in one line
<path stroke="#000" d="m15,5a7,7 0 1,0 0,9m16,1a7,7 0 1,0-9,0M48,3a7,7 0 1,0 5,7M8,25a7,7 0 1,0 6,13M32,27a7,7 0 1,0 0,9m18-9a7,7 0 1,0 0,9"/>saving a few bytes. - I rather make descriptions in the file description Infobox, instead of within the SVG code - but this may anybody do as preferred. Some like
titleanddesc.
My concept needs 452 bytes, your original 1413. -- sarang♥사랑 07:40, 28 April 2021 (UTC)
- @Sarang: I missed notification of your messages and just seen them. Thanks a lot – very kind of you to work on my logo. I originally wanted to use it in my talk signature but learnt that images are not allowed, so haven't really used it. Amazing work reducing it to 452 bytes: you really know the tricks! Cheers, cmɢʟee ⋅τaʟκ 01:05, 26 May 2021 (UTC)
SVG drawing
[edit]- Hi, it is a great idea of you to fill an image with a circle instead of with a path. I will use it in future!
- Are you really sure that all your drawings are
{{self|cc-by-sa-4.0|GFDL}}? Some are sure ineligible. - You make fine drawings. It would be also fine when you classify them - using the Template:Igen. -- sarang♥사랑 08:44, 28 April 2021 (UTC)
- @Sarang: Thanks, my pleasure. I just use the default option. Some may indeed consist of just simple shapes but it's hard to know for sure what's eligible for copyright. I'd use Igen if it were simpler to remember; as it is, the codes are a mystery to me. Looking at Template:Image_generation, what options to use doesn't seem at all obvious. Cheers, cmɢʟee ⋅τaʟκ 01:12, 26 May 2021 (UTC)
Hi
[edit]File:Nucleosynthesis periodic table.svg Hi, can you edit technetium (43) and promethium (61), because they do occur in nature, plus it will be nice if you add the heavier synthetic elements. Kamran Tetra (talk) 16:05, 25 May 2021 (UTC)
- Thanks for the feedback. If you take a look at File_talk:Nucleosynthesis_periodic_table.svg, you'll see that there have been many requests for corrections. Considering it has been well-researched and vetted twice by NASA's Astronomy Picture of the Day team, I am hesitant to update it unless there is very strong evidence that there is a mistake. Cheers, cmɢʟee ⋅τaʟκ 01:19, 26 May 2021 (UTC)
File:Interstellar probes trajectory.svg
[edit]Dear CmgLee,
I really love your graphics, and I’d like to ask you about your excellent plot of spacecraft and planets over the last 50 years. This is the first time I’ve sent a message, so I’m not sure if I’m doing it correctly or if I’ve sent it twice, so please bear with me!
I’ve been trying to produce an A1-sized map of the largest 150 solar system bodies and spacecraft out to about 150AU, where Voyager 1 currently is. It’ll be a plan view looking down from the ecliptic north pole, with distances on a quasi-logarithmic scale, using data from JPL’s Horizons ephemerides. I’d like to plot most planets’ and spacecrafts’ positions over a period of time – about 100 years for the most distant planets beyond Pluto, and over the period of one orbit for closer planets.
I’ve attached a rough sketch which I created in Microsoft Word, mainly because I don’t know how to use any other programmes, though I can use basic Photoshop and have a very basic understanding of HTML, but I don’t (yet) know anything about SVG or scripts. I’ve only plotted the approximate locations over time of the inner planets from Mercury to Saturn, but I did so using Word text boxes following a circular path. This makes it difficult to plot locations in exactly the right spot on the background circular graph paper.
Ok I tried to upload a screenshot, but I keep getting an error message saying “We could not determine whether this file is suitable” — how would I get round that? Meanwhile I’ve uploaded my screenshot to: https://ibb.co/yQvfhMT
So how did you create your graphic? I’m hoping there’s some magic programme where you just select a planet and the date range, then it automatically plots the circle, but I’ve just read your comment saying that you wrote a Python script, whatever that is.
Could you please let me know how you did it, what software is required, any good resources for teaching myself how to write the script, and any other tips? So far I’ve started compiling the distances and heliocentric longitudes into an Excel table; I’m not that interested in latitudes as I’m only creating a 2D plan, although I’ll probably add some symbols to indicate whether a planet is above or below the ecliptic. The only other complication is that my planned distance scale will be uneven – very roughly 1AU per square on the graph paper for the inner planets, 5AU per square for the outer planets, then 10AU per square for objects beyond Neptune.
Thanks very much! HalcyonGeezer (talk) 13:02, 4 June 2021 (UTC).
- Hi @HalcyonGeezer: Thanks for your message and compliment. Nice idea to create a plot for 100 years, though beware that the inner planets will likely be simply solid circles along their orbits; even Jupiter will have gone round around 8.4 times.[1] I expect a diagram with 150 bodies will appear very cluttered, considering mine with 7, plus 5 probes is already rather so. You could omit the year markers, though you would lose context on their relative positions with time.
- If you view-source https://upload.wikimedia.org/wikipedia/commons/0/0a/Interstellar_probes_trajectory.svg and delete the first line, you'll get the Python script I used to create the graphic. You're welcome to customise it under the current licence, CC-BY-SA 4.0
- Without a full-fledged programming language, the best option I can think of is to use scatter plots in Excel or similar.
- Both Word and Photoshop formats are unsupported on Wikimedia as they are proprietary, which I think technically requires licences to write readers for. You can upload PDFs instead.
- If you haven't seen it, Solar System Live has several views you can adapt for your purpose. Unfortunately its resolution is pretty low by today's standards.
- Hope that's enough to start with. I'd love to see what you come up with.
- Cheers,
cmɢʟee ⋅τaʟκ 21:40, 4 June 2021 (UTC)
References
Thanks very much for the tips @Cmglee — I'll do some research into Python scripts, and I'll let you know if I make any progress! HalcyonGeezer (talk) 18:53, 8 June 2021 (UTC)
Definition
[edit]Would it be ok if I could use this image in helping me definite the term, 'transverse plane'? CaptainFelix1368 (talk) 09:59, 6 June 2021 (UTC)
- @CaptainFelix1368: I'm unsure which file you are referring to, but sure, as long as you satisfy its licence requirements. Suggested templates can be found under the Use this file on the web or Use this file on a wiki links on its file description page. Cheers, cmɢʟee ⋅τaʟκ 10:19, 6 June 2021 (UTC)
File:Solar system bodies rotation animation.svg
[edit]Hi @Cmglee: ,
I want to translate the texts displayed in Solar system bodies rotation animation.svg to Turkish to use in the article Gezegen (planet in English). But my lack of command in coding and SVG files prevents me from doing it. If you can collaborate with me, I want to translate this file into Turkish. If it's an easy job for you, I provided you the Turkish translations of the words and some minor corrections. If it's not an easy job, then I would want to know how I can translate the words displayed in this file myself. Turkish translations and corrections should be like this:

- Jupiter / Jüpiter,
- Saturn / Satürn,
- Neptune / Neptün,
- Uranus / Uranüs,
- Earth / Dünya,
- Mars / Mars,
- Moon / Ay,
- Mercury / Merkür,
- Venus / Venüs,
- Rotation period / Dönme süresi
- Flattening / Basıklık
- Axial tilt / Eksen eğikliği
- The "d"s in rotation period section / g
- and all percentage symbols (%) must be before the values, not after them. For example: %6.5, %9.8, %1.7
This is all you need to publish a Turkish version of this SVG. I really would appreciate the help. Thank you. --Harald the Bard (talk) 15:34, 17 June 2021 (UTC)
- @Harald the Bard: Thanks for your interest in my diagram. I'll try to do that this weekend. Instead of creating a new file, I'll make it a multilingual file. Cheers, cmɢʟee ⋅τaʟκ 22:34, 17 June 2021 (UTC)
 Done @Harald the Bard: Animation in a browser depends on the system language. Cheers, cmɢʟee ⋅τaʟκ 01:03, 20 June 2021 (UTC)
- @Cmglee: thank you very much for your attention and work. I will use the diagram as soon as I done translating the corresponding part of the article. I really appreciate it, thank you! Cheers, --Harald the Bard (talk) 21:49, 21 June 2021 (UTC)
- @Harald the Bard: Glad to help! Thanks, too, for working on article's Turkish translation. Let me know if you think any other STEM illustrations are worth looking into. Cheers, cmɢʟee ⋅τaʟκ 23:00, 21 June 2021 (UTC)
Phase diagram of water
[edit]Hi, Cmglee, I have added the Spanish translation of the Phase Diagram of water. How could I upload it? --Antonio González Fernández (talk) 13:28, 24 June 2021 (UTC)
- @Antonio González Fernández: Many thanks for adding the Spanish translation. Did you use change the English text in the file, or use systemLanguage to add Spanish text?
- Change English text: Click Upload file
- Use systemLanguage: Click Upload a new version of this file
- and follow the instructions on the page. Please let me know if you have further questions. Cheers, cmɢʟee ⋅τaʟκ 21:36, 24 June 2021 (UTC)

|
File:Generation timeline.svg has been listed at Commons:Deletion requests so that the community can discuss whether it should be kept or not. We would appreciate it if you could go to voice your opinion about this at its entry.
If you created this file, please note that the fact that it has been proposed for deletion does not necessarily mean that we do not value your kind contribution. It simply means that one person believes that there is some specific problem with it, such as a copyright issue. Please see Commons:But it's my own work! for a guide on how to address these issues. |
— Jeff G. ツ please ping or talk to me 14:34, 10 July 2021 (UTC)
Use of File:Eratosthenes measure of Earth circumference
[edit]Hi Cmglee, I am an author wishing to use this image but in a modified way. Please email me on riaz_dean@yahoo.com so we can discuss further. Many thanks for your assistance! Riaz. — Preceding unsigned comment added by Riaz Dean (talk • contribs) 21:13, 17 July 2021 (UTC)
A barnstar for you!
[edit]
|
The Graphic Designer's Barnstar |
| how Betseg (talk) 12:22, 25 July 2021 (UTC) |
@Betseg: Thank you very much; much appreciated! cmɢʟee ⋅τaʟκ 20:09, 25 July 2021 (UTC)
AR6 extreme event frequency increase
[edit]Dear CMG Lee, as the IPCC AR6 WG1 Full Report is almost 4000 pages long, could you be so kind and add to the discription of the graph on extreme weather events

on which page(s) you found the data? --Gunnar (talk) 22:22, 1 September 2021 (UTC)
Graph of herd immunity threshold (HIT) vs basic reproduction number (R0)
[edit]Hello Cmglee,
I was going to create a HIT vs R0 graph but you have beaten me to it. Congratulations, it is exactly what I wanted to see. There two critical items missing though.
The first is the definition of who makes up the total population. It should be everyone who can catch the diseases. Our politicians are using misleading definitions such as "only people who are eligible to be vaccinated". This is allowing them to make false promises of achieving HIT targets. Please add the qualifier that the curves are for the total population.
The second item is you should provide proper references for the source of the data, back to original publications in reputable peer reviewed journals. This is necessary to give confidence that the graph is based on accurate information. I believe there will be great disappointment with the results of many government vaccination policies and "thresholds" to open up societies. Your graph will be used in some future debates so must be defendable.
I suspect we will be dealing with further covid-19 variants over the next 5+ years. People will need to understand what HIT rate is really required to control the virus. Your graph should be part of that effort.
Thanks for your good work.
Ernest Waddington Victoria, Australia — Preceding unsigned comment was added by 121.45.126.9 (talk) 09:17, 23 September 2021 (UTC)
- Hi Ernest,
- Thanks for your message. Feel free to update the caption and image description as appropriate (I don't know the best wording to use).
- The R0 values are from en:Basic_reproduction_number#Sample_values_for_various_infectious_diseases.
- Cheers,
cmɢʟee ⋅τaʟκ 12:26, 14 October 2021 (UTC)
Risk board image
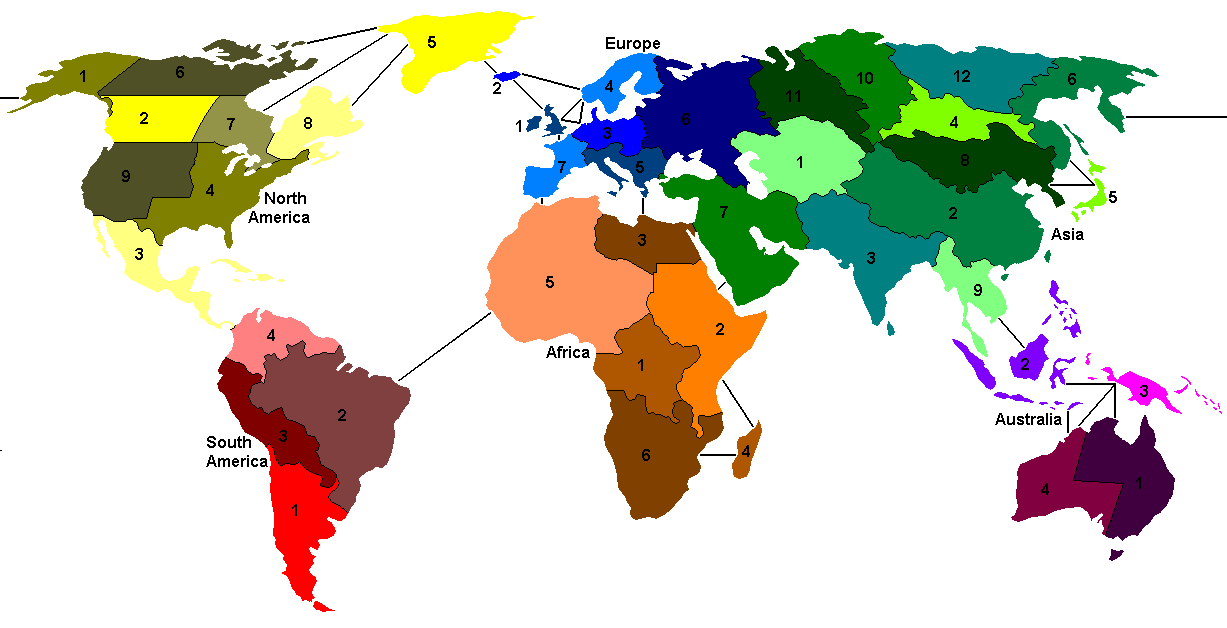
[edit]Apologies if I'm disobeying Wiki protocols; I'm not familiar with the community and wasn't sure how to communicate with a user. I was looking at an SVG image of the Risk game board (https://upload.wikimedia.org/wikipedia/commons/5/5d/Risk_game_board.svg) and I wanted to report what I believe is a problem with it. Looking at other pictures of the Risk board, such as https://i.pinimg.com/originals/ae/44/2d/ae442d7e848ad1bce549d2f21ee73f9c.jpg and https://upload.wikimedia.org/wikipedia/commons/9/9d/Risk_game_map.png, it looks like New Guinea is supposed to be attached to Western Australia. In your version, New Guinea has two separate attachments to Indonesia and is not attached to Western Australia. Sincerely, Anonymous User (IP 73.223.250.56) 16:16, 17 October 2021 (UTC) — Preceding unsigned comment was added by 73.223.250.56 (talk) 16:17, 17 October 2021 (UTC)
- Many thanks for bringing this to my attention – well spotted! I've fixed it in the latest revision. By the way, what you did to contact me was absolutely correct protocol. I've just moved your message to the end to keep chronological order. Thanks for checking, cmɢʟee ⋅τaʟκ 21:49, 19 October 2021 (UTC)
Eratosthenes measure of Earth circumference.svg
[edit]Hi, I am an author ("Mapping the Great Game") wanting to use a modified version of your map (re. Eratosthenes) in my upcoming book. Please send me your email address so I can contact you to discuss further. Thanks! Riaz Dean — Preceding unsigned comment added by Riaz Dean (talk • contribs) 01:07, 25 October 2021 (UTC)
- Thanks, I've emailed you using http://commons.wikimedia.org/wiki/Special:EmailUser/Riaz_Dean . Cheers, cmɢʟee ⋅τaʟκ 11:38, 25 October 2021 (UTC)
FP Promotion
[edit] |
The image File:Everest-3D-Map-Type-EN.jpg, that you uploaded is now assessed as one of the finest pictures on Wikimedia Commons, the nomination is available at Commons:Featured picture candidates/File:Everest-3D-Map-Type-EN.jpg. Thank you for your contribution. If you would like to nominate, please do so at this nomination page. |
/FPCBot (talk) 05:00, 10 November 2021 (UTC)
Volume of an n-ball
[edit]Your marvelous picture was recently deleted from [1]. I disagree. Guswen (talk) 00:38, 23 November 2021 (UTC)
- Hi @Guswen, Thanks for your compliment and for telling me. That's a pity. I'll contribute my view on the talk page. Cheers, cmɢʟee ⋅τaʟκ 10:02, 2 December 2021 (UTC)
File:3_utilities_problem_moebius.svg
[edit]Good morning, i saw your file File:3 utilities problem moebius.svg and i noted that the large yellow and the thiny blu lines pass directly from left front sheet to the right front sheet, but in reality they must pass through rear sheet around the hole. May you draw tho circular dashed line around the hole in your work? Thank you and best regards --Ming mm (talk) 09:43, 2 December 2021 (UTC)
p.s. I'm an italian engeneer and rarely write in english, there may be some mistake in what i wrote, forgive me.
- Hi @Ming mm, Thanks! No problem about the English: I think I understood you perfectly.

- The paths are embedded in the sheet and so appear on both sides of it. If they were on only one side and go around the hole, the blue line would remain closer to the hole and when they reappeared on the other side, they would have swapped positions compared to the diagram and would need to cross. This is equivalent to the case of a simple plane. Feel free to enquire at en:Wikipedia:Reference_desk/Mathematics and CC me. Cheers, cmɢʟee ⋅τaʟκ 09:57, 2 December 2021 (UTC)
- P.S. Please see this discussion, too.
Thank you, i read your links and i understud where i was wrong... i consider the real moebius ladder rather then a single sheet ladder... I saw many your works when i surf wiki, and i thought you was very busy on wiki for answer quickly to me, but i discovered you are very kind too. It's a pleasure to meet people like that, best regards --Ming mm (talk) 13:24, 2 December 2021 (UTC)
- Hi @Ming mm, Thank you for your very kind words. Contributing to Wiki*edia is my favourite hobby, so I'm happy to help out readers and editors where I can, as many people on the reference desks are too. Please feel free to ask or suggest anything, especially if there's a maths, science or engineering concept that's worth illustrating. Best wishes, cmɢʟee ⋅τaʟκ 23:47, 4 December 2021 (UTC)
File:Visualisation_complex_number_roots.svg
[edit]I think the visualization is too cluttered to be useful - writing out the full complex form obscures the fact that for complex numbers, (unit) multiplication is rotation about the origin, so we can just write φ, φζ, φζ², etc. --Wqwt (talk) 22:47, 4 December 2021 (UTC)
- Hi @Wqwt, thanks for the suggestion. I agree that it's pretty cluttered but I couldn't find simpler labels. That's an interesting idea. I haven't encountered φ, φζ, φζ², etc before. Is it in common use? Do you have any good figures for reference? Cheers, cmɢʟee ⋅τaʟκ 23:43, 4 December 2021 (UTC)
Wikipedia G-Force tolerance graph
[edit]Very nice graphic. I would like to use it (with appropriate credit) in Stack Exchange Space Exploration forum. Can you give references for the original data? The moderators are sticklers for sources. Thanks Woody
- Thanks, Woody. As I specified on the file description page, it was from http://aupress.maxwell.af.mil/Books/Brulle/Brulle.pdf at the time it was made, specifically, Robert V. Brulle (2008) Engineering the Space Age: A Rocket Scientist Remembers, Air University Press, p. 135 ISBN: 978-1-58566-184-8. . In the future, please leave a message on user_talk:cmglee, instead of an archived page like this one. Cheers, cmɢʟee ⋅τaʟκ 23:18, 10 December 2021 (UTC)
| 2O11 | 2O12 | 2O13 | 2O14 | 2O15 | 2O16 | 2O17 | 2O18 | 2O19 | 2O2O |
| 2O21 | 2O22 | 2O23 | 2O24 | ||||||